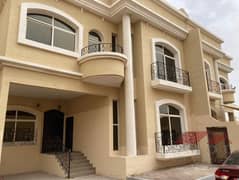
Bayut’s Abu Dhabi Rental Market Report for H1 2023
- Top Neighbourhoods
- Affordable Apartment Rentals
- Luxury Apartment Rentals
- Affordable Villa Rentals
- Luxury Villa Rentals
With the first half of 2023 in the record books, it’s time to analyse the trends and patterns within Abu Dhabi’s real estate sector. Bayut’s Abu Dhabi rental market report for H1 2023 evaluates the industry’s performance and examines tenant search preferences over the past six months.
The date contained within our Abu Dhabi H1 rental real estate market report 2023 shows that prices for apartments in the affordable sector have increased, particularly in the mainland districts, pointing at a shift in demand from suburbs to central locations. Affordable villas have generally become more expensive, with the prices of luxury properties in Abu Dhabi also having increased in most cases.
A quick look at the Abu Dhabi rent trends shows:
- Rents for affordable apartments and villas generally increased by up to 8%, with price reductions observed for certain bed types.
- In most cases, rental prices for luxury properties recorded upticks of up to 11%.
To give you a detailed view of the Abu Dhabi rental market, we have compared average rents for villas and apartments from H1 2023 to those observed in H2 2022 (excluding room share).
RENTAL TRENDS IN ABU DHABI: TOP NEIGHBOURHOODS FOR RENTING VILLAS AND APARTMENTS IN H1 2023
As per Bayut’s data for H1 2023 it is clear that the demand for larger homes still remains steady. With demand increasing for villas, there is greater stability in the prices for affordable flats across prominent districts of the city.
According to the data gathered for Bayut’s Abu Dhabi H1 rental real estate market report 2023, tenants prioritising affordability showed the most interest in:
- Khalifa City
- Al Khalidiyah
- Mohammed Bin Zayed City
Those looking for luxurious properties in Abu Dhabi preferred the following popular communities:
- Al Reem Island
- Al Raha Beach
- Al Raha Gardens
- Yas Island
In the upcoming sections of this Bayut Abu Dhabi H1 2023 real estate market report, we take an in-depth look at the stats related to villas and apartments in the capital’s affordable and luxury real estate sectors.
KHALIFA CITY IS THE MOST PREFERRED AREA TO RENT AFFORDABLE FLATS IN ABU DHABI
RENTAL PRICES IN ABU DHABI FOR AFFORDABLE APARTMENTS IN POPULAR AREAS – BAYUT’S H1 2023 MARKET REPORT
POPULAR AREAS | STUDIO Avg. Yearly RentChange from H2 2022 | 1-BED Avg. Yearly RentChange from H2 2022 | 2-BED Avg. Yearly RentChange from H2 2022 |
|---|---|---|---|
| Khalifa City | STUDIO Avg. Yearly RentChange from H2 2022
| 1-BED Avg. Yearly RentChange from H2 2022
| 2-BED Avg. Yearly RentChange from H2 2022
|
| Al Khalidiyah | 2-BED Avg. Yearly RentChange from H2 2022
| 2-BED Avg. Yearly RentChange from H2 2022
| 2-BED Avg. Yearly RentChange from H2 2022
|
| Al Muroor | STUDIO Avg. Yearly RentChange from H2 2022
| 1-BED Avg. Yearly RentChange from H2 2022
| 2-BED Avg. Yearly RentChange from H2 2022
|
| Hamdan Street | STUDIO Avg. Yearly RentChange from H2 2022
| 1-BED Avg. Yearly RentChange from H2 2022
| 2-BED Avg. Yearly RentChange from H2 2022
|
| Al Shamkha | STUDIO Avg. Yearly RentChange from H2 2022
| 1-BED Avg. Yearly RentChange from H2 2022
| 2-BED Avg. Yearly RentChange from H2 2022
|
According to the Abu Dhabi rental market report for H1 2023, Khalifa City emerged as the most popular choice to rent affordable apartments in Abu Dhabi:
- Studios and 2-bed flats for rent in Khalifa City witnessed no change in asking rents. However, prices for 1-bed apartments for rent increased by 1.44% from H2 2022.
- On average, tenants paid AED 28k for studios, AED 42k for 1-bed and AED 61k for 2-bedroom flats for rent in Khalifa City during H1 2023.
Al Khalidiyah bagged the second spot on the popularity index for reasonably-priced flats in Abu Dhabi:
- Apartments for rent in Al Khalidiyah reported modest price fluctuations from those recorded in H2 2022. The average rental cost of studios in Al Khalidiyah increased by 5.19%, whereas the asking prices for 1-bedroom rental apartments increased by 1.06%. The average prices for 2-bedroom rental flats however, declined by 1.91% during H1 2023.
- The asking rent for studios in Al Khalidiyah averaged at AED 30k, whereas 1 and 2-bedroom apartments for rent in Al Khalidiyah were available for AED 52k and AED 66k, respectively.
Budget-conscious tenants also showed interest in Al Muroor during the first half of 2023:
- Studio and 1-bedroom rental apartments in Al Muroor reported price increases of 3.45% and 5.97%, respectively. The cost of 2-bed rental flats in Al Muroor remained unchanged in H1 2023.
- On average, tenants paid AED 31k for studios, AED 42k for 1-bed and AED 53k for 2-bedroom units during H1 2023 to rent apartments in Al Muroor.
Renters interested in affordable accommodation in Abu Dhabi also searched for flats in:
- Hamdan Street
- Al Shamkha
Average rents in Hamdan Street for 1-bed flats increased by 7.51%. The asking rents for studios and 1-bed apartments in Al Shamkha declined by 3.42% and 4.41%, respectively. Rents for other bed types in both areas remained unchanged in H1 2023.
AL REEM ISLAND TAKES THE TOP SPOT AMONG LUXURY APARTMENT RENTALS IN ABU DHABI
RENTAL PRICES IN ABU DHABI FOR LUXURY APARTMENTS – BAYUT’S H1 2023 PROPERTY MARKET REPORT FOR ABU DHABI
POPULAR AREAS | 1-BED Avg. Yearly RentChange from H2 2022 | 2-BED Avg. Yearly RentChange from H2 2022 | 3-BED Avg. Yearly RentChange from H2 2022 |
|---|---|---|---|
| Al Reem Island | 1-BED Avg. Yearly RentChange from H2 2022
| 2-BED Avg. Yearly RentChange from H2 2022
| 3-BED Avg. Yearly RentChange from H2 2022
|
| Al Raha Beach | 1-BED Avg. Yearly RentChange from H2 2022
| 2-BED Avg. Yearly RentChange from H2 2022
| 3-BED Avg. Yearly RentChange from H2 2022
|
| Corniche Area | 1-BED Avg. Yearly RentChange from H2 2022
| 2-BED Avg. Yearly RentChange from H2 2022
| 3-BED Avg. Yearly RentChange from H2 2022
|
| Yas Island | 1-BED Avg. Yearly RentChange from H2 2022
| 2-BED Avg. Yearly RentChange from H2 2022
| 3-BED Avg. Yearly RentChange from H2 2022
|
| Saadiyat Island | 1-BED Avg. Yearly RentChange from H2 2022
| 2-BED Avg. Yearly RentChange from H2 2022
| 3-BED Avg. Yearly RentChange from H2 2022
|
Al Reem Island remained the top choice among those searching for high-end apartments in Abu Dhabi:
- The average rents for apartments in Al Reem Island reported a modest increase across all bed types: 0.38% for 1-bed, 2.08% for 2-bed and 0.14% for 3-bedroom flats.
- Renting a 1-bedroom apartment in Al Reem Island cost around AED 59k. The 2-bedroom flats were available for AED 88k and 3-bedroom units for rent were priced at AED 128k in H1 2023.
The demand for high-end waterfront apartments in Abu Dhabi’s Al Raha Beach also remained high in H1 2023:
- Prices for 1-bed rental apartments in Al Raha Beach decreased by 2.21%. The 3-bed rental apartments in Al Raha Beach also became more affordable by 4.61% in H1 2023. The 2-bed rental flats witnessed no change in average annual rents.
- The asking rents for 1-bed flats averaged at AED 62k, whereas 2 and 3-bed rental apartments in Al Raha Beach were priced at AED 98k and AED 157k, respectively.
Those interested in luxury apartment living also considered properties in Corniche Area:
- The average rent for 1-bedroom apartments in the Corniche Area decreased by 6.83%. However, the rental costs for 2 and 3-bedroom flats in the Corniche Area increased by 3.39% and 6.93%, respectively.
- On average, 1-bedroom apartments in Corniche Area were priced at AED 73k, whereas 2 and 3-bedroom rental flats were available for AED 109k and AED 130k.
Apart from the areas mentioned above, tenants showed an inclination towards these coveted communities in Abu Dhabi:
- Yas Island
- Saadiyat Island
The average rents for apartments in Yas Island recorded significant increases of up to 12.4%, with the rental flats in Saadiyat Island also becoming more more expensive by up to 10.7%.
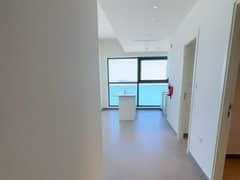
- 3 BEDS
- |
- 4 BATHS
- |
- 1566 SQFT

- 1 BED
- |
- 2 BATHS
- |
- 1021 SQFT
- 2 BEDS
- |
- 3 BATHS
- |
- 1506 SQFT

- 2 BEDS
- |
- 2 BATHS
- |
- 1142 SQFT

- 2 BEDS
- |
- 2 BATHS
- |
- 1782 SQFT
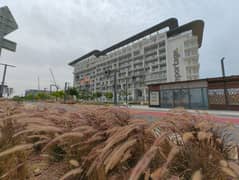
- 2 BEDS
- |
- 3 BATHS
- |
- 1162 SQFT
MBZ CITY IS THE MOST POPULAR CHOICE FOR AFFORDABLE VILLAS FOR RENT IN ABU DHABI
TOP AREAS TO RENT AFFORDABLE VILLAS IN ABU DHABI – BAYUT H1 2023 ABU DHABI MARKET REPORT
POPULAR AREAS | 3-BED Avg. Yearly RentChange from H2 2022 | 4-BED Avg. Yearly RentChange from H2 2022 | 5-BED Avg. Yearly RentChange from H2 2022 |
|---|---|---|---|
| Mohammed Bin Zayed City | 3-BED Avg. Yearly RentChange from H2 2022
| 4-BED Avg. Yearly RentChange from H2 2022
| 5-BED Avg. Yearly RentChange from H2 2022
|
| Khalifa City | 3-BED Avg. Yearly RentChange from H2 2022
| 4-BED Avg. Yearly RentChange from H2 2022
| 5-BED Avg. Yearly RentChange from H2 2022
|
| Madinat Al Riyadh | 3-BED Avg. Yearly RentChange from H2 2022
| 4-BED Avg. Yearly RentChange from H2 2022
| 5-BED Avg. Yearly RentChange from H2 2022
|
| Al Reef | 3-BED Avg. Yearly RentChange from H2 2022
| 4-BED Avg. Yearly RentChange from H2 2022
| 5-BED Avg. Yearly RentChange from H2 2022
|
| Al Shamkha | 3-BED Avg. Yearly RentChange from H2 2022
| 4-BED Avg. Yearly RentChange from H2 2022
| 5-BED Avg. Yearly RentChange from H2 2022
|
Mohammed Bin Zayed City (MBZ City) remained the top choice for tenants looking to rent affordable villas in Abu Dhabi during H1 2023:
- Rents of villas in Mohammed Bin Zayed City reported increases across the board.
- The highest 6.15% increase was recorded for 3-bed villas in Mohammed Bin Zayed City. The 4-bedroom villas recorded a 1.51% increase in asking rents, whereas the average rent for 5-bedroom homes in Mohammed Bin Zayed City was 0.36% higher than in H2 2022.
- On average, tenants spent AED 93k for 3-bed villas, AED 128k for 4-bed houses and AED 147k for 5-bed units in Mohammed Bin Zayed City.
The family-friendly suburb of Khalifa City was another favourite among budget-conscious renters as per the Abu Dhabi rental market report for H1 2023:
- Average prices for 4-bed rental houses in Khalifa City increased by 4.14%. However, 3 and 5-bed villas in Khalifa City recorded a decline of 0.52% and 1.65% in average rents.
- Rent for villas in Khalifa City averaged at AED 149k for 3-bed, AED 160k for 4-bed and AED 171k for 5-bed units.
Other areas that caught the interest of villa renters in H1 2023 include:
- Madinat Al Riyadh
- Al Reef
- Al Shamkha
The average rents in these districts generally decreased by up to 9.71%. However, the 3 and 5-bed houses in Al Shamkha and 4-bed houses in Madinat Al Riyadh recorded rental increases of up to 6.38%.
AL RAHA GARDENS IS THE MOST POPULAR AREA FOR LUXURY VILLA RENTALS IN ABU DHABI
TOP AREAS FOR RENTING LUXURY VILLAS IN ABU DHABI – H1 2023
POPULAR AREAS | 4-BED Avg. Yearly RentChange from H2 2022 | 5-BED Avg. Yearly RentChange from H2 2022 | 6-BED Avg. Yearly RentChange from H2 2022 |
|---|---|---|---|
| Al Raha Gardens | 4-BED Avg. Yearly RentChange from H2 2022
| 5-BED Avg. Yearly RentChange from H2 2022
| 6-BED Avg. Yearly RentChange from H2 2022
|
| Yas Island | 4-BED Avg. Yearly RentChange from H2 2022
| 5-BED Avg. Yearly RentChange from H2 2022
| 6-BED Avg. Yearly RentChange from H2 2022
|
| Al Mushrif | 4-BED Avg. Yearly RentChange from H2 2022
| 5-BED Avg. Yearly RentChange from H2 2022
| 6-BED Avg. Yearly RentChange from H2 2022
|
| Al Bateen | 4-BED Avg. Yearly RentChange from H2 2022
| 5-BED Avg. Yearly RentChange from H2 2022
| 6-BED Avg. Yearly RentChange from H2 2022
|
| Saadiyat Island | 4-BED Avg. Yearly RentChange from H2 2022
| 5-BED Avg. Yearly RentChange from H2 2022
| 6-BED Avg. Yearly RentChange from H2 2022
|
| Not available due to low/no historical inventory or influx of off-plan properties | |||
When it comes to luxury villas, Al Raha Gardens captured the most interest from tenants as per the H1 rental market report for Abu Dhabi 2023:
- The average price for 4-bed villas for rent in Al Raha Gardens dropped by 9.51%, possibly due to landlords pricing their properties competitively in order to increase demand. On the contrary, 5-bed rental houses in Al Raha Gardens recorded an increase of 3.44% from H2 2022.
- On average, tenants spent AED 168k for 4-bed houses and AED 227k for 5-bed villas in Al Raha Gardens during H1 2023.
As per our Abu Dhabi property rental market H1 2023 analysis, tenants looking for high-end villas also gravitated towards properties in Yas Island:
- The asking rents for 4-bed villas in Yas Island recorded an increase of 4.37%, with 5-bed houses for rent in Yas Island becoming more expensive by 2.56% in H1 2023.
- On average, the 4-bed houses in Yas Island were priced at AED 325k. Rent for 5-bed villas in Yas Island averaged at AED 309k.
Al Mushrif was another area that garnered the attention of tenants looking for luxury houses in Abu Dhabi:
- The average cost of rental villas in Al Mushrif experienced a decline across the 4, 5 and 6-bed categories in H1 2023.
- The decrease in rental costs for 4 and 5-bed was recorded at 4.10% and 3.55%, respectively. However, 6-bed villas experienced an 11% decrease in rental costs compared to H2 2022.
- The asking rents of 4 and 5-bedroom houses in Al Mushrif averaged at AED 173k and AED 203k, respectively. On average, 6-bedroom villas for rent in Al Mushrif were priced at AED 209k in H1 2023.
Besides these areas, tenants focused their interest on the following:
- Al Bateen
- Saadiyat Island
Average rents in these neighbourhoods generally increased by up to 7.93% in the first half of 2023, with the exception of 4 and 6-bed houses in Al Bateen that became more affordable by up to 10.1%.
- 5 BEDS
- |
- 8 BATHS
- |
- 4998 SQFT
Commenting on the trends, the CEO of Bayut and Head of Dubizzle Group MENA, Haider Khan, said:
“Six months into 2023, and we’re loving what we’re witnessing right now with the market being at one of its best stages ever. The much-discussed millionaire migration is a very real factor, with HNWIs from around the globe dedicating significant budgets for investment in UAE real estate. For those investors, the lure of Abu Dhabi’s luxurious island communities is obvious. Highly-desired and established locales such as Yas Island and Saadiyat Island, along with upcoming master-projects like that of Jubail Island, look set to ensure that investor interest will remain significant for some time yet.
It’s also interesting to note that according to DARI, there were about 2,000+ sales transactions for ready properties in the emirate during the first half of 2023, with value more than doubling since the same period in 2022. Whilst investors taking advantage of favourable market conditions is undoubtedly a factor in that high number, it’s also likely that holistic increases across Abu Dhabi’s rental sector are bearing an influence with more people opting to become homeowners than paying large sums in rents.
We can see this rising interest in the growth of our traffic as well. In the last six months we have had nearly 6.5 million visits just for properties advertised in Abu Dhabi. This number has been steadily increasing over the years and we can expect to go even higher with more international interest coming into the Abu Dhabi market.”
That ends our Abu Dhabi rental market report H1 2023. If you’re looking for similar insight into the neighbouring emirate’s real estate market, it’s worth checking out Bayut’s Dubai rental market report H1 2023.
For more information and updates about the UAE real estate sector, stay tuned to MyBayut.
Disclaimer: The average prices in the above Abu Dhabi rental property market report (MKTRPTH12023) are based on ready properties advertised by real estate agencies on behalf of their clients on Bayut.com (excluding room share), and is not representative of actual real estate transactions conducted in Abu Dhabi.

