Bayut’s Abu Dhabi Rental Market Report H1 2025
- At a Glance
- Affordable Apartment Rentals
- Mid-Tier Apartment Rentals
- Luxury Apartment Rentals
- Affordable Villa Rentals
- Mid-Tier Villa Rentals
- Luxury Villa Rentals
Abu Dhabi’s rental market demonstrated remarkable resilience and growth throughout the first half of 2025, continuing the trends established last year. This comprehensive Abu Dhabi Rental Market Report H1 2025 analyses the rental rate fluctuations for both apartments and villas across the emirate’s most sought-after residential districts.
For Abu Dhabi Rental Market Report H1 2025, we have segmented the popular areas for rental apartments and villas into ‘Affordable,’ ‘Mid-tier’ and ‘Luxury’ categories to provide a more tailored view of the Abu Dhabi rental trends 2025.
AT A GLANCE: ABU DHABI RENTAL MARKET REPORT H1 2025
Abu Dhabi rental trends 2025 for the first six months of the year demonstrate comprehensive growth across all segments:
- Affordable apartment rental increases ranged from 2% to 21%, while villa rents rose by up to 13%.
- Mid-tier apartments recorded rental increases ranging from 3% to 19%. Villas, however, recorded a more modest growth of up to 7%.
- Luxury apartment rentals saw growth of up to 14% and villas recorded increases of 7% in popular communities.
- Khalifa City was the go-to area for affordable apartments, Al Reem Island was preferred for mid-tier rentals and Saadiyat Island has attracted luxury seekers.
- Khalifa City has appealed to tenants for affordable villa rentals, Al Raha Gardens attracted mid-range tenants and Yas Island was the preferred destination for luxury renters.
To identify consumer search and trends in the Abu Dhabi Rental Market Report H1 2025, our data analysts have compared the average asking rents during H1 2025 to those observed during H2 2024.
KHALIFA CITY HAS EMERGED AS THE MOST POPULAR AFFORDABLE AREA FOR APARTMENT RENTALS
Trends for Affordable Apartments – Abu Dhabi Real Estate Rental Report H1 2025
POPULAR AREAS | STUDIO Avg. Yearly RentChange from H2 2024 | 1-BED Avg. Yearly RentChange from H2 2024 | 2-BED Avg. Yearly RentChange from H2 2024 |
|---|---|---|---|
| Khalifa City | STUDIO Avg. Yearly RentChange from H2 2024
| 1-BED Avg. Yearly RentChange from H2 2024
| 2-BED Avg. Yearly RentChange from H2 2024
|
| Al Shamkha | STUDIO Avg. Yearly RentChange from H2 2024
| 1-BED Avg. Yearly RentChange from H2 2024
| 2-BED Avg. Yearly RentChange from H2 2024
|
| Al Nahyan | STUDIO Avg. Yearly RentChange from H2 2024
| 1-BED Avg. Yearly RentChange from H2 2024
| 2-BED Avg. Yearly RentChange from H2 2024
|
- Khalifa City, Al Shamkha and Al Nahyan dominated the affordable apartment rental segment, according to the H1 2025 Rental Market Report for Abu Dhabi.
- Apartment rentals in these areas increased by between 2% and 21%, with Al Nahyan recording the highest price growth for 2-bedroom apartments.
AL REEM ISLAND HAS LED THE MID-TIER APARTMENT RENTAL MARKET
Mid-tier Apartment Prices – H1 2025 Rental Market Report for Abu Dhabi
POPULAR AREAS | STUDIO Avg. Yearly RentChange from H2 2024 | 1-BED Avg. Yearly RentChange from H2 2024 | 2-BED Avg. Yearly RentChange from H2 2024 |
|---|---|---|---|
| Al Reem Island | STUDIO Avg. Yearly RentChange from H2 2024
| 1-BED Avg. Yearly RentChange from H2 2024
| 2-BED Avg. Yearly RentChange from H2 2024
|
| Al Khalidiyah | STUDIO Avg. Yearly RentChange from H2 2024
| 1-BED Avg. Yearly RentChange from H2 2024
| 2-BED Avg. Yearly RentChange from H2 2024
|
| Tourist Club Area (TCA) | STUDIO Avg. Yearly RentChange from H2 2024
| 1-BED Avg. Yearly RentChange from H2 2024
| 2-BED Avg. Yearly RentChange from H2 2024
|
- Popular areas for apartment rentals in the mid-tier segment experienced growth of between 4% and 68% in H1 2025.
- Al Reem Island, Tourist Club Area (TCA) and Al Khalidiyah remained the most sought-after options in this category.
- Tourist Club Area experienced the most dramatic growth in the studio apartment category, with a remarkable 67.8% increase, driven by increased demand against limited inventory.
AL RAHA BEACH HAS CONTINUED TO DOMINATE LUXURY APARTMENT RENTALS
Luxury Apartments Performance – Abu Dhabi Rental Market Report for H1 2025
POPULAR AREAS | 1-BED Avg. Yearly RentChange from H2 2024 | 2-BED Avg. Yearly RentChange from H2 2024 | 3-BED Avg. Yearly RentChange from H2 2024 |
|---|---|---|---|
| Al Raha Beach | 1-BED Avg. Yearly RentChange from H2 2024
| 2-BED Avg. Yearly RentChange from H2 2024
| 3-BED Avg. Yearly RentChange from H2 2024
|
| Yas Island | 1-BED Avg. Yearly RentChange from H2 2024
| 2-BED Avg. Yearly RentChange from H2 2024
| 3-BED Avg. Yearly RentChange from H2 2024
|
| Saadiyat Island | 1-BED Avg. Yearly RentChange from H2 2024
| 2-BED Avg. Yearly RentChange from H2 2024
| 3-BED Avg. Yearly RentChange from H2 2024
|
- Saadiyat Island, Yas Island and Al Raha Beach emerged as the premier destinations for luxury apartment rentals in Abu Dhabi during H1 2025, with price hikes between 3% and 13%.
- Al Raha Beach recorded the strongest price growth in the luxury segment, with a 13.1% increase in 1-bed rentals. Luxury apartments for rent in Saadiyat Island commanded the highest rental rates despite a price reduction for 2 and 3-bed units.
- 2 BEDS
- |
- 3 BATHS
- |
- 1387 SQFT
- 1 BED
- |
- 1 BATH
- |
- 671 SQFT
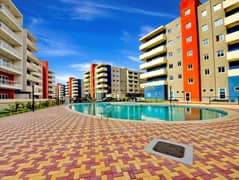
- 2 BEDS
- |
- 2 BATHS
- |
- 1145 SQFT
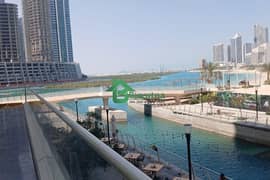
- 2 BEDS
- |
- 3 BATHS
- |
- 1045 SQFT
KHALIFA CITY HAS OFFERED THE MOST SOUGHT-AFTER AFFORDABLE VILLA RENTALS
Popular Areas for Affordable Villas – Abu Dhabi Rental Market Report H1 2025
POPULAR AREAS | 3-BED Avg. Yearly RentChange from H2 2024 | 4-BED Avg. Yearly RentChange from H2 2024 | 5-BED Avg. Yearly RentChange from H2 2024 |
|---|---|---|---|
| Khalifa City | 3-BED Avg. Yearly RentChange from H2 2024
| 4-BED Avg. Yearly RentChange from H2 2024
| 5-BED Avg. Yearly RentChange from H2 2024
|
| Shakhbout City | 3-BED Avg. Yearly RentChange from H2 2024
| 4-BED Avg. Yearly RentChange from H2 2024
| 5-BED Avg. Yearly RentChange from H2 2024
|
| Al Shamkha | 3-BED Avg. Yearly RentChange from H2 2024
| 4-BED Avg. Yearly RentChange from H2 2024
| 5-BED Avg. Yearly RentChange from H2 2024
|
- Budget-conscious tenants seeking affordable villas for rent in Abu Dhabi gravitated towards Al Shamkha, Shakhbout City and Khalifa City according to the H1 2025 Rental Market Report for Abu Dhabi.
- The budget-friendly category recorded 2% to 13% growth in villa rentals, with the highest surge noticed in asking rents for 3-bed villas in Al Shamkha.
AL RAHA GARDENS HAS LED MID-TIER VILLA RENTALS
Preferred Areas for Mid-tier Villa Rentals – Abu Dhabi Real Estate Rental Report H1 2025
POPULAR AREAS | 3-BED Avg. Yearly RentChange from H2 2024 | 4-BED Avg. Yearly RentChange from H2 2024 | 5-BED Avg. Yearly RentChange from H2 2024 |
|---|---|---|---|
| Al Raha Gardens | 3-BED Avg. Yearly RentChange from H2 2024
| 4-BED Avg. Yearly RentChange from H2 2024
| 5-BED Avg. Yearly RentChange from H2 2024
|
| Al Muroor | 3-BED Avg. Yearly RentChange from H2 2024
| 4-BED Avg. Yearly RentChange from H2 2024
| 5-BED Avg. Yearly RentChange from H2 2024
|
| Al Mushrif | 3-BED Avg. Yearly RentChange from H2 2024
| 4-BED Avg. Yearly RentChange from H2 2024
| 5-BED Avg. Yearly RentChange from H2 2024
|
| Not available due to low/no historical inventory or influx of off-plan properties | |||
- Al Raha Gardens, Al Muroor and Al Mushrif appealed to tenants searching for mid-tier villa rentals as per the Bayut Abu Dhabi Real Estate Rental Report H1 2025.
- The mid-tier villa segment reported price hikes of 3% to 7%. However, 5-bed rental villas in Al Raha Gardens experienced a 7.4% decrease.
YAS ISLAND HAS DOMINATED LUXURY VILLA RENTALS
Popular Communities for Luxury Villas – Abu Dhabi Rental Market Report for H1 2025
POPULAR AREAS | 4-BED Avg. Yearly RentChange from H2 2024 | 5-BED Avg. Yearly RentChange from H2 2024 | 6-BED Avg. Yearly RentChange from H2 2024 |
|---|---|---|---|
| Yas Island | 4-BED Avg. Yearly RentChange from H2 2024
| 5-BED Avg. Yearly RentChange from H2 2024
| 6-BED Avg. Yearly RentChange from H2 2024
|
| Saadiyat Island | 4-BED Avg. Yearly RentChange from H2 2024
| 5-BED Avg. Yearly RentChange from H2 2024
| 6-BED Avg. Yearly RentChange from H2 2024
|
| Al Bateen | 4-BED Avg. Yearly RentChange from H2 2024
| 5-BED Avg. Yearly RentChange from H2 2024
| 6-BED Avg. Yearly RentChange from H2 2024
|
| Not available due to low/no historical inventory or influx of off-plan properties | |||
- Tenants seeking luxury villa rentals in Abu Dhabi focused primarily on Yas Island, Saadiyat Island and Al Bateen during H1 2025.
- The luxury villa market in Al Bateen and Saadiyat Island demonstrated growth of between 3% and 6%.
- Yas Island rental prices experienced reductions, with prices for 4-bedroom villas down by 1.76% and 5-bedroom units down by 6.09%.
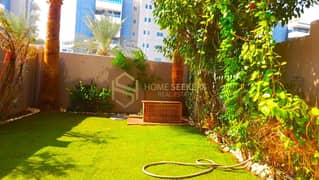
- 2 BEDS
- |
- 3 BATHS
- |
- 1203 SQFT
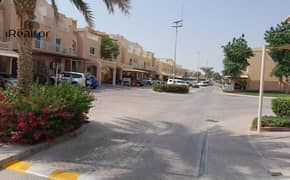
- 2 BEDS
- |
- 3 BATHS
- |
- 1261 SQFT

- 3 BEDS
- |
- 4 BATHS
- |
- 1873 SQFT
Check out Bayut’s Dubai Rental Market Report for H1 2025 for in-depth insights into how rents in the emirate fluctuated during the first 6 months of the year.
The Abu Dhabi Real Estate Rental Report H1 2025, presented above, is based on proprietary market data and industry analysis for the first half of 2025, reflecting actual transaction trends and rental developments across the emirate’s key residential communities.
