
Bayut’s H1 2025 Dubai Rental Market Report
- At a Glance
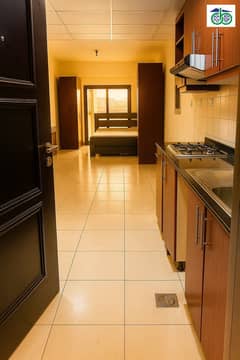
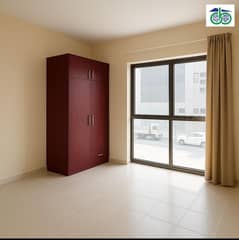
- Affordable Apartment Rentals
- Mid-Tier Apartment Rentals
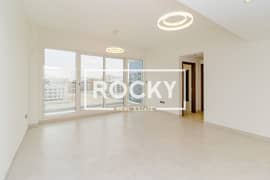
- Luxury Apartment Rentals
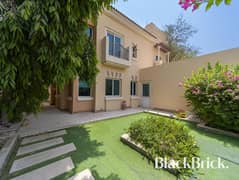
- Affordable Villa Rentals
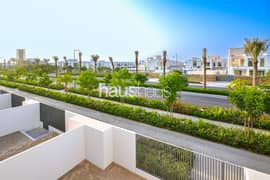
- Mid-Tier Villa Rentals
- Luxury Villa Rentals
With the first half of 2025 wrapped up, it’s the perfect time to assess how Dubai’s rental market is performing. In our comprehensive Dubai Rental Market Report for H1 2025, we break down the shifts in rental rates for apartments and villas across the city’s most popular residential neighbourhoods, based on listings tracked on Bayut.
We have segmented the popular areas for rental apartments and villas into ‘Affordable,’ ‘Mid-tier’ and ‘Luxury’ categories to provide a more tailored view of the Dubai rental market.
AT A GLANCE: DUBAI RENTAL MARKET H1 2025
Dubai’s rental market in H1 2025 saw a measured increase in prices across affordable and luxury segments:
- Rents for budget-friendly properties increased by up to 9%.
- Mid-tier rentals saw a general growth of up to 7%, but certain apartment and villa bed types in Jumeirah Village Circle and villas in Al Furjan reported decreases of up to 13%.
- High-end properties experienced general rent hikes of as much as 53%, but 4-bed villas across some popular districts did report decreases in asking rents.
- Based on user search trends, Bur Dubai topped the list for affordable apartments, while Jumeirah Village Circle remained the most popular mid-market choice. Those looking for upscale apartments gravitated towards Dubai Marina.
- In the villa segment, DAMAC Hills 2 led among affordable options, with Al Furjan appealing to mid-range renters. Dubai Hills Estate continued to be the preferred destination for luxury villa seekers.
To identify consumer search and rental trends in the Dubai property market H1 2025, our data analysts have compared the average asking rents advertised on Bayut during H1 2025 (excluding room share) to those observed during H2 2024.
BUR DUBAI EMERGES AS THE MOST POPULAR AREA FOR AFFORDABLE APARTMENT RENTALS
RENTAL PRICES FOR AFFORDABLE APARTMENTS IN POPULAR AREAS – DUBAI RENTAL MARKET REPORT H1 2025
POPULAR AREAS | TRANSACTION PRICE Avg. Yearly RentChange from H2 2024 | STUDIO Avg. Yearly RentChange from H2 2024 | 1-BED Avg. Yearly RentChange from H2 2024 | 2-BED Avg. Yearly RentChange from H2 2024 |
|---|---|---|---|---|
| Bur Dubai | TRANSACTION PRICE Avg. Yearly RentChange from H2 2024
| STUDIO Avg. Yearly RentChange from H2 2024
| 1-BED Avg. Yearly RentChange from H2 2024
| 2-BED Avg. Yearly RentChange from H2 2024
|
| Arjan | TRANSACTION PRICE Avg. Yearly RentChange from H2 2024
| STUDIO Avg. Yearly RentChange from H2 2024
| 1-BED Avg. Yearly RentChange from H2 2024
| 2-BED Avg. Yearly RentChange from H2 2024
|
| Deira | TRANSACTION PRICE Avg. Yearly RentChange from H2 2024
| STUDIO Avg. Yearly RentChange from H2 2024
| 1-BED Avg. Yearly RentChange from H2 2024
| 2-BED Avg. Yearly RentChange from H2 2024
|
- Rental apartments in Bur Dubai, Arjan and Deira emerged as popular choices for tenants seeking affordable accommodation.
- Rental costs in these areas rose by up to 7%. While asking rents continue to rise, backed by considerable demand, there has been a slowdown in the trajectory, noticeable in the decreasing rental costs for 2-bed flats in Bur Dubai and 1-bed apartments in Deira.
JUMEIRAH VILLAGE CIRCLE REMAINS A TOP CHOICE FOR MID-TIER APARTMENT RENTALS
RENTS FOR MID-TIER APARTMENTS IN POPULAR AREAS – DUBAI RENTAL MARKET REPORT H1 2025
POPULAR AREAS | TRANSACTION PRICE Avg. Yearly RentChange from H2 2024 | STUDIO Avg. Yearly RentChange from H2 2024 | 1-BED Avg. Yearly RentChange from H2 2024 | 2-BED Avg. Yearly RentChange from H2 2024 |
|---|---|---|---|---|
| Jumeirah Village Circle | TRANSACTION PRICE Avg. Yearly RentChange from H2 2024
| STUDIO Avg. Yearly RentChange from H2 2024
| 1-BED Avg. Yearly RentChange from H2 2024
| 2-BED Avg. Yearly RentChange from H2 2024
|
| Business Bay | TRANSACTION PRICE Avg. Yearly RentChange from H2 2024
| STUDIO Avg. Yearly RentChange from H2 2024
| 1-BED Avg. Yearly RentChange from H2 2024
| 2-BED Avg. Yearly RentChange from H2 2024
|
| Jumeirah Lake Towers | TRANSACTION PRICE Avg. Yearly RentChange from H2 2024
| STUDIO Avg. Yearly RentChange from H2 2024
| 1-BED Avg. Yearly RentChange from H2 2024
| 2-BED Avg. Yearly RentChange from H2 2024
|
- In the mid-tier segment, rental apartments in Jumeirah Village Circle remained the most popular option. Tenants also considered the rental apartments in Business Bay and Jumeirah Lake Towers.
- Rental costs in these districts recorded upticks as high as 6%. The only exception was noticed for 1-bed flats in Jumeirah Lake Towers, which became cheaper by 1.48%.
DUBAI MARINA CONTINUES TO BE FAVOURED FOR LUXURY APARTMENT RENTALS
RENTS FOR LUXURY APARTMENTS – DUBAI RENTAL MARKET REPORT H1 2025
POPULAR AREAS | TRANSACTION PRICE Avg. Yearly RentChange from H2 2024 | 1-BED Avg. Yearly RentChange from H2 2024 | 2-BED Avg. Yearly RentChange from H2 2024 | 3-BED Avg. Yearly RentChange from H2 2024 |
|---|---|---|---|---|
| Dubai Marina | TRANSACTION PRICE Avg. Yearly RentChange from H2 2024
| 1-BED Avg. Yearly RentChange from H2 2024
| 2-BED Avg. Yearly RentChange from H2 2024
| 3-BED Avg. Yearly RentChange from H2 2024
|
| Downtown Dubai | TRANSACTION PRICE Avg. Yearly RentChange from H2 2024
| 1-BED Avg. Yearly RentChange from H2 2024
| 2-BED Avg. Yearly RentChange from H2 2024
| 3-BED Avg. Yearly RentChange from H2 2024
|
| Dubai Creek Harbour | TRANSACTION PRICE Avg. Yearly RentChange from H2 2024
| 1-BED Avg. Yearly RentChange from H2 2024
| 2-BED Avg. Yearly RentChange from H2 2024
| 3-BED Avg. Yearly RentChange from H2 2024
|
- For luxury apartment rentals, tenants mostly gravitated towards Dubai Marina, Downtown Dubai and Dubai Creek Harbour.
- Property price trends noted in these areas reveal that apartment rents generally decreased by up to 5%. However, certain bed types in Dubai Marina and Downtown Dubai experienced price hikes of up to 3%.
- 1 BED
- |
- 2 BATHS
- |
- 726 SQFT
- 1 BED
- |
- 2 BATHS
- |
- 721 SQFT
- 1 BED
- |
- 1 BATH
- |
- 1558 SQFT
- 1 BED
- |
- 2 BATHS
- |
- 717 SQFT
- STUDIO
- |
- 1 BATH
- |
- 477 SQFT
- STUDIO
- |
- 1 BATH
- |
- 444 SQFT
- 1 BED
- |
- 2 BATHS
- |
- 816 SQFT
- 1 BED
- |
- 1 BATH
- |
- 639 SQFT
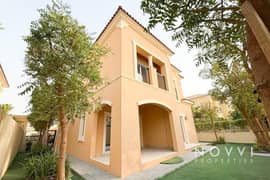
DAMAC HILLS 2 IS THE TOP CHOICE FOR AFFORDABLE VILLA RENTALS IN DUBAI
POPULAR AREAS FOR AFFORDABLE VILLAS – DUBAI RENTAL MARKET REPORT H1 2025
POPULAR AREAS | TRANSACTION PRICE Avg. Yearly RentChange from H2 2024 | 3-BED Avg. Yearly RentChange from H2 2024 | 4-BED Avg. Yearly RentChange from H2 2024 | 5-BED Avg. Yearly RentChange from H2 2024 |
|---|---|---|---|---|
| DAMAC Hills 2 | TRANSACTION PRICE Avg. Yearly RentChange from H2 2024
| 3-BED Avg. Yearly RentChange from H2 2024
| 4-BED Avg. Yearly RentChange from H2 2024
| 5-BED Avg. Yearly RentChange from H2 2024
|
| Mirdif | TRANSACTION PRICE Avg. Yearly RentChange from H2 2024
| 3-BED Avg. Yearly RentChange from H2 2024
| 4-BED Avg. Yearly RentChange from H2 2024
| 5-BED Avg. Yearly RentChange from H2 2024
|
| Dubai South | TRANSACTION PRICE Avg. Yearly RentChange from H2 2024
| 3-BED Avg. Yearly RentChange from H2 2024
| 4-BED Avg. Yearly RentChange from H2 2024
| 5-BED Avg. Yearly RentChange from H2 2024
|
| Not available due to low/no historical inventory or influx of off-plan properties | ||||
- Tenants looking for affordable housing preferred the rental villas in DAMAC Hills 2, Mirdif and Dubai South.
- These popular neighbourhoods recorded increases of up to 9% in rental costs during H1 2025.
AL FURJAN LEADS FOR MID-TIER VILLA RENTALS
POPULAR AREAS FOR MID-TIER VILLAS – DUBAI RENTAL MARKET REPORT H1 2025
POPULAR AREAS | TRANSACTION PRICE Avg. Yearly RentChange from H2 2024 | 3-BED Avg. Yearly RentChange from H2 2024 | 4-BED Avg. Yearly RentChange from H2 2024 | 5-BED Avg. Yearly RentChange from H2 2024 |
|---|---|---|---|---|
| Al Furjan | TRANSACTION PRICE Avg. Yearly RentChange from H2 2024
| 3-BED Avg. Yearly RentChange from H2 2024
| 4-BED Avg. Yearly RentChange from H2 2024
| 5-BED Avg. Yearly RentChange from H2 2024
|
| Jumeirah Village Circle | TRANSACTION PRICE Avg. Yearly RentChange from H2 2024
| 3-BED Avg. Yearly RentChange from H2 2024
| 4-BED Avg. Yearly RentChange from H2 2024
| 5-BED Avg. Yearly RentChange from H2 2024
|
| Arabian Ranches 3 | TRANSACTION PRICE Avg. Yearly RentChange from H2 2024
| 3-BED Avg. Yearly RentChange from H2 2024
| 4-BED Avg. Yearly RentChange from H2 2024
| 5-BED Avg. Yearly RentChange from H2 2024
|
| Not available due to low/no historical inventory or influx of off-plan properties | ||||
- During H1 2025, those looking for mid-tier villa rentals focused their attention on Al Furjan, Jumeirah Village Circle and Arabian Ranches 3.
- Rental values in these areas generally decreased by up to 13%, with the exception of certain bed types that recorded more moderate upticks of under 7%.
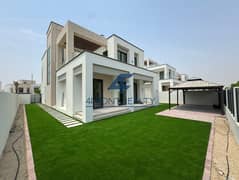
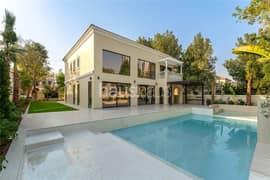
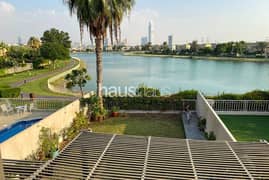
DUBAI HILLS ESTATE REMAINS THE TOP CHOICE FOR LUXURY VILLA RENTALS
POPULAR COMMUNITIES FOR LUXURY VILLAS – DUBAI RENTAL MARKET REPORT H1 2025
POPULAR AREAS | TRANSACTION PRICE Avg. Yearly RentChange from H2 2024 | 4-BED Avg. Yearly RentChange from H2 2024 | 5-BED Avg. Yearly RentChange from H2 2024 | 6-BED Avg. Yearly RentChange from H2 2024 |
|---|---|---|---|---|
| Dubai Hills Estate | TRANSACTION PRICE Avg. Yearly RentChange from H2 2024
| 4-BED Avg. Yearly RentChange from H2 2024
| 5-BED Avg. Yearly RentChange from H2 2024
| 6-BED Avg. Yearly RentChange from H2 2024
|
| DAMAC Hills | TRANSACTION PRICE Avg. Yearly RentChange from H2 2024
| 4-BED Avg. Yearly RentChange from H2 2024
| 5-BED Avg. Yearly RentChange from H2 2024
| 6-BED Avg. Yearly RentChange from H2 2024
|
| Jumeirah | TRANSACTION PRICE Avg. Yearly RentChange from H2 2024
| 4-BED Avg. Yearly RentChange from H2 2024
| 5-BED Avg. Yearly RentChange from H2 2024
| 6-BED Avg. Yearly RentChange from H2 2024
|
| Not available due to low/no historical inventory or influx of off-plan properties | ||||
- Dubai Hills Estate emerged as the top choice for tenants interested in renting upscale villas. Other areas that appealed to high-income tenants include DAMAC Hills and Jumeirah.
- Rental costs for houses in these communities generally increased by between 2% and 53%. The most significant uptick was recorded for 5-bedroom rental villas in Dubai Hills Estate, following the increased inventory of homes in Palm Hills, Maple and Golf Place Terraces.
- However, the 4-bed villas reported decreases of up to 9% in asking rents across the board.

- 5 BEDS
- |
- 5 BATHS
- |
- 6675 SQFT
- 4 BEDS
- |
- 5 BATHS
- |
- 5396 SQFT
- 5 BEDS
- |
- 5 BATHS
- |
- 4368 SQFT
Commenting on the findings, Haider Ali Khan, CEO of Bayut and dubizzle, Head of Dubizzle Group MENA and Board Member of the Dubai Chamber of Digital Economy, said:


“Dubai’s rental market is starting to stabilise after a period of rapid growth. With over 72,000 new units expected this year, the pressure on rents is slowly starting to ease, offering more breathing room and better choices for tenants. And with the rent-versus-buy debate picking up, especially now that prices are levelling out, we’re seeing more people take a serious look at homeownership. The First-Time Home Buyer initiative launched by DLD is also nudging renters to consider making that leap, offering access to exclusive units and attractive financing. This is where agents, backed by tools like TruBroker™, play a key role in helping people explore their options and make confident, well-informed decisions.”
That concludes our Dubai Rental Market Report for H1 2025. For insights on real estate investments, check out our Dubai Sales Market Report for H1 2025, which covers property prices in the emirate’s most sought-after areas.
Stay tuned to MyBayut for upcoming property market reports for Abu Dhabi, set to be released later this week.
Disclaimer: The average prices in the above Dubai rental property market report (MKTRPTH12025) are based on ready properties advertised by real estate agencies on behalf of their clients on Bayut.com (excluding room share), and is not representative of actual real estate transactions conducted in Dubai, unless specified as based on DLD data.


