
Bayut’s Dubai Sales Market Report for H1 2025
- At a Glance
- Affordable Apartments
- Mid-Tier Apartments
- Luxury Apartments
- Affordable Villas
- Mid-tier Villas
- Luxury Villas
- Highest ROIs
- Off-plan Properties
With the first half of the year wrapped up, it’s the perfect time to reflect on how property prices evolved throughout Dubai’s residential real estate sector during H1 2025. Dubai’s property market continued its upward trajectory, albeit at a slower pace, with property values appreciating and investment activity showing strength across all market segments. Bayut’s Dubai Property Sales Market Report for H1 2025 offers a detailed insight into the price movements throughout the emirate’s most popular neighbourhoods, giving buyers and investors clear insight into market trends.
We have segregated popular areas for buying apartments and villas into ‘Affordable,’ ‘Mid-tier’ and ‘Luxury’ to offer a more tailored view of the Dubai property market in H1 2025.
AT A GLANCE: DUBAI PROPERTY SALES MARKET H1 2025
Bayut’s data reveals steady price appreciation across all property tiers in H1 2025 compared to H2 2024:
- Affordable homes in Dubai saw price increases of 3% to 10%.
- Mid-range properties recorded price appreciation of up to 10%.
- Luxury real estate registered up to 8% growth in price per square foot.
- Notable areas included Dubai Silicon Oasis for affordable apartments, Jumeirah Village Circle for mid-tier flats and Dubai Marina for high-end residences.
- Investors exploring villas showed strong interest in DAMAC Hills 2 (affordable), Al Furjan (mid-tier) and Arabian Ranches (luxury).
For an accurate representation of Dubai property price trends, our H1 2025 sales market report compares the average price-per-square-foot for an area to H2 2024. Please note that these prices are subject to change based on multiple factors, including amenities available, the developer involved in the project, location and other key factors.
DUBAI SILICON OASIS IS THE MOST POPULAR AREA TO BUY AFFORDABLE APARTMENTS IN DUBAI
AVERAGE SALES PRICES FOR AFFORDABLE APARTMENTS: BAYUT DUBAI SALES MARKET REPORT H1 2025
POPULAR AREAS | ROI | PRICE PER SQ.FT Avg. Price/sq.ftChange from H2 2024 | TRANSACTION PRICE Avg. Transaction PriceChange from H2 2024 | STUDIO | 1-BED | 2-BED |
|---|---|---|---|---|---|---|
| Dubai Silicon Oasis | ROI 8.81% | PRICE PER SQ.FT Avg. Price/sq.ftChange from H2 2024
| TRANSACTION PRICE Avg. Transaction PriceChange from H2 2024
| STUDIO
| 1-BED
| 2-BED
|
| Dubai Sports City | ROI 8.88% | PRICE PER SQ.FT Avg. Price/sq.ftChange from H2 2024
| TRANSACTION PRICE Avg. Transaction PriceChange from H2 2024
| STUDIO
| 1-BED
| 2-BED
|
| International City | ROI 10.4% | PRICE PER SQ.FT Avg. Price/sq.ftChange from H2 2024
| TRANSACTION PRICE Avg. Transaction PriceChange from H2 2024
| STUDIO
| 1-BED
| 2-BED
|
- Buyers looking for reasonably priced apartments in Dubai showed a preference for Dubai Silicon Oasis, Dubai Sports City and International City.
- Prices per square foot for affordable apartments in Dubai Silicon Oasis, Dubai Sports City and International City increased between 1% and 7%.
- Transaction prices rose from between 3% and 10%.
JUMEIRAH VILLAGE CIRCLE HAS REMAINED THE MOST POPULAR AREA TO BUY MID-TIER APARTMENTS IN DUBAI
AVERAGE SALES PRICES FOR MID-TIER APARTMENTS: BAYUT DUBAI SALES MARKET REPORT H1 2025
POPULAR AREAS | ROI | PRICE PER SQ.FT Avg. Price/sq.ftChange from H2 2024 | TRANSACTION PRICE Avg. Transaction PriceChange from H2 2024 | STUDIO | 1-BED | 2-BED |
|---|---|---|---|---|---|---|
| Jumeirah Village Circle | ROI 7.77% | PRICE PER SQ.FT Avg. Price/sq.ftChange from H2 2024
| TRANSACTION PRICE Avg. Transaction PriceChange from H2 2024
| STUDIO
| 1-BED
| 2-BED
|
| Business Bay | ROI 6.72% | PRICE PER SQ.FT Avg. Price/sq.ftChange from H2 2024
| TRANSACTION PRICE Avg. Transaction PriceChange from H2 2024
| STUDIO
| 1-BED
| 2-BED
|
| Jumeirah Lake Towers | ROI 7.52% | PRICE PER SQ.FT Avg. Price/sq.ftChange from H2 2024
| TRANSACTION PRICE Avg. Transaction PriceChange from H2 2024
| STUDIO
| 1-BED
| 2-BED
|
- Jumeirah Village Circle was the most sought-after district in the mid-market segment for apartment sales, followed by Business Bay and Jumeirah Lake Towers.
- Prices per square foot rose by up to 3%, while average transaction values increased between 3% and 13%.
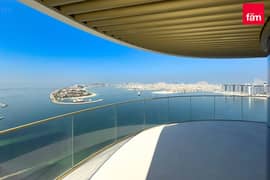
DUBAI MARINA HOLDS INVESTOR INTEREST FOR LUXURY APARTMENTS IN H1 2025
AVERAGE SALES PRICES FOR LUXURY APARTMENTS: DUBAI REAL ESTATE SALES MARKET REPORT H1 2025
POPULAR AREAS | ROI | PRICE PER SQ.FT Avg. Price/sq.ftChange from H2 2024 | TRANSACTION PRICE Avg. Transaction PriceChange from H2 2024 | 1-BED | 2-BED | 3-BED |
|---|---|---|---|---|---|---|
| Dubai Marina | ROI 6.39% | PRICE PER SQ.FT Avg. Price/sq.ftChange from H2 2024
| TRANSACTION PRICE Avg. Transaction PriceChange from H2 2024
| 1-BED
| 2-BED
| 3-BED
|
| Downtown Dubai | ROI 5.79% | PRICE PER SQ.FT Avg. Price/sq.ftChange from H2 2024
| TRANSACTION PRICE Avg. Transaction PriceChange from H2 2024
| 1-BED
| 2-BED
| 3-BED
|
| Dubai Creek Harbour | ROI 5.93% | PRICE PER SQ.FT Avg. Price/sq.ftChange from H2 2024
| TRANSACTION PRICE Avg. Transaction PriceChange from H2 2024
| 1-BED
| 2-BED
| 3-BED
|
- Dubai Marina, Downtown Dubai and Dubai Creek Harbour continued to attract investors looking for luxury apartments in Dubai.
- Sales prices in these neighbourhoods rose by up to 4%, holistically highlighting the steady demand for upgraded apartments in Dubai Marina, the upscale inventory available in Downtown Dubai and the impressive new units in Dubai Creek Harbour.
- STUDIO
- |
- 1 BATH
- |
- 442 SQFT
- STUDIO
- |
- 1 BATH
- |
- 384 SQFT
- 3 BEDS
- |
- 4 BATHS
- |
- 2338 SQFT
- 3 BEDS
- |
- 5 BATHS
- |
- 1633 SQFT
- 1 BED
- |
- 1 BATH
- |
- 824 SQFT
- 2 BEDS
- |
- 2 BATHS
- |
- 787 SQFT

DAMAC HILLS 2 RANKS AS THE MOST POPULAR CHOICE FOR BUYING AFFORDABLE VILLAS IN DUBAI
AVERAGE PROPERTY PRICES IN DUBAI TO BUY AFFORDABLE HOUSES: BAYUT DUBAI H1 SALES MARKET REPORT 2025
POPULAR AREAS | ROI | PRICE PER SQ.FT Avg. Price/sq.ftChange from H2 2024 | TRANSACTION PRICE Avg. Transaction PriceChange from H2 2024 | 3-BED | 4-BED | 5-BED |
|---|---|---|---|---|---|---|
| DAMAC Hills 2 | ROI 6.64% | PRICE PER SQ.FT Avg. Price/sq.ftChange from H2 2024
| TRANSACTION PRICE Avg. Transaction PriceChange from H2 2024
| 3-BED
| 4-BED
| 5-BED
|
| Dubai South | ROI 5.06% | PRICE PER SQ.FT Avg. Price/sq.ftChange from H2 2024
| TRANSACTION PRICE Avg. Transaction PriceChange from H2 2024
| 3-BED
| 4-BED
| 5-BED
|
| Dubailand | ROI 5.52% | PRICE PER SQ.FT Avg. Price/sq.ftChange from H2 2024
| TRANSACTION PRICE Avg. Transaction PriceChange from H2 2024
| 3-BED
| 4-BED
| 5-BED
|
- Dubai H1 2025 real estate trends reveal that villas in DAMAC Hills 2, Dubai South and Dubailand were the go-to choices for affordable villa buyers.
- Prices per square foot increased from between 3% and 11%.
- Sales transaction data from Dubailand revealed an increase in residential plot purchases, evident in the nearing 26% growth in average transaction price.
AL FURJAN RANKS AS THE MOST POPULAR CHOICE FOR BUYING MID-TIER VILLAS IN DUBAI
AVERAGE PROPERTY PRICES IN DUBAI TO BUY MID-TIER HOUSES: DUBAI REAL ESTATE SALES MARKET REPORT H1 2025
POPULAR AREAS | ROI | PRICE PER SQ.FT Avg. Price/sq.ftChange from H2 2024 | TRANSACTION PRICE Avg. Transaction PriceChange from H2 2024 | 3-BED | 4-BED | 5-BED |
|---|---|---|---|---|---|---|
| Al Furjan | ROI 5.39% | PRICE PER SQ.FT Avg. Price/sq.ftChange from H2 2024
| TRANSACTION PRICE Avg. Transaction PriceChange from H2 2024
| 3-BED
| 4-BED
| 5-BED
|
| Jumeirah Village Circle (JVC) | ROI 7.28% | PRICE PER SQ.FT Avg. Price/sq.ftChange from H2 2024
| TRANSACTION PRICE Avg. Transaction PriceChange from H2 2024
| 3-BED
| 4-BED
| 5-BED
|
| Arabian Ranches 3 | ROI 5.59% | PRICE PER SQ.FT Avg. Price/sq.ftChange from H2 2024
| TRANSACTION PRICE Avg. Transaction PriceChange from H2 2024
| 3-BED
| 4-BED
| 5-BED
|
- In H1 2025, Al Furjan emerged as the most popular area for mid-tier villa purchases in Dubai, followed closely by Jumeirah Village Circle (JVC) and Arabian Ranches 3.
- Sale prices per square foot in these neighbourhoods appreciated between 6% and 10%.
- According to Dubai Land Department data, average transaction prices across these areas rose by 5% to 13%.
ARABIAN RANCHES HOLDS THE TOP SPOT FOR BUYING LUXURY HOMES IN DUBAI
REAL ESTATE PRICES IN DUBAI FOR LUXURY VILLAS IN POPULAR NEIGHBOURHOODS: BAYUT DUBAI SALES MARKET REPORT H1 2025
POPULAR AREAS | ROI | PRICE PER SQ.FT Avg. Price/sq.ftChange from H2 2024 | TRANSACTION PRICE Avg. Transaction PriceChange from H2 2024 | 4-BED | 5-BED | 6-BED |
|---|---|---|---|---|---|---|
| Arabian Ranches | ROI 3.94% | PRICE PER SQ.FT Avg. Price/sq.ftChange from H2 2024
| TRANSACTION PRICE Avg. Transaction PriceChange from H2 2024
| 4-BED
| 5-BED
| 6-BED
|
| DAMAC Hills | ROI 5.60% | PRICE PER SQ.FT Avg. Price/sq.ftChange from H2 2024
| TRANSACTION PRICE Avg. Transaction PriceChange from H2 2024
| 4-BED
| 5-BED
| 6-BED
|
| Dubai Hills Estate | ROI 4.39% | PRICE PER SQ.FT Avg. Price/sq.ftChange from H2 2024
| TRANSACTION PRICE Avg. Transaction PriceChange from H2 2024
| 4-BED
| 5-BED
| 6-BED
|
- Among high-end villa communities, Arabian Ranches topped the charts as the most favoured destination in 2024, maintaining its reputation as a premier choice for families. DAMAC Hills and Dubai Hills Estate also featured prominently among luxury investors.
- Prices per square foot for villas in Arabian Ranches, Dubai Hills Estate and DAMAC Hills appreciated by 2% to 8%.
- Supporting data from the DLD showed transaction price growth in these areas ranging from 6% to 25%, representing an increased demand for premium, family-friendly properties.
- 5 BEDS
- |
- 6 BATHS
- |
- 5348 SQFT
AREAS WITH THE BEST ROI FOR APARTMENTS AND VILLAS IN DUBAI
HIGHEST RENTAL YIELDS FOR APARTMENTS IN DUBAI
AREA | SEGMENT | ROI |
|---|---|---|
AREA International City | SEGMENT Affordable | ROI 10.4% |
AREA Living Legends | SEGMENT Mid-tier | ROI 9.49% |
AREA Al Sufouh | SEGMENT Luxury | ROI 8.90% |
According to the data accumulated for the Dubai Sales Market Report H1 2025, areas offering apartments with the best rental returns in Dubai included International City (affordable), Living Legends (mid-tier) and Al Sufouh (luxury).
Other areas offering high rental income for apartments:
- Affordable segment:
- Dubai Investment Park (10.2%)
- Discovery Gardens (9.64%)
- Mid-tier segment:
- Town Square (8.15%)
- Al Furjan (7.99%)
- Luxury segment:
- Green Community (8.42%)
- DAMAC Hills (7.74%)
HIGHEST RENTAL YIELDS FOR VILLAS IN DUBAI
AREA | SEGMENT | ROI |
|---|---|---|
AREA DAMAC Hills 2 | SEGMENT Affordable | ROI 6.64% |
AREA Jumeirah Village Circle | SEGMENT Mid-tier | ROI 7.28% |
AREA Al Barari | SEGMENT Luxury | ROI 6.89% |
Villa investors looking for high ROI villas in Dubai focused on areas offering the ideal mix of demand and community lifestyle, including DAMAC Hills 2 (affordable), Jumeirah Village Circle (mid-tier) and Al Barari (luxury).
Other areas offering high rental yields for villas include:
- Affordable segment:
- Dubai Industrial City (5.98%)
- Serena (5.85%)
- Mid-tier segment:
- Mudon (5.80%)
- Town Square (5.71%)
- Luxury segment:
- Dubai Creek Harbour (6.05%)
- Jumeirah Golf Estates (5.91%)
The projected ROIs for apartments and villas in Dubai may vary depending on the location of the building/unit, its developer and the amenities offered.
POPULAR AREAS FOR OFF-PLAN PROPERTIES IN DUBAI
TOP PROJECTS FOR OFF-PLAN APARTMENTS IN DUBAI
PROJECT | AREA | SEGMENT |
|---|---|---|
PROJECT Verdana Residence | AREA Dubai Investment Park (DIP) | SEGMENT Affordable |
PROJECT International City Phase 2 | AREA International City | SEGMENT Affordable |
PROJECT Jade Tower | AREA Majan | SEGMENT Affordable |
PROJECT JVC District 12 | AREA Jumeirah Village Circle | SEGMENT Mid-tier |
PROJECT Dubai Healthcare City Phase 2 | AREA Al Jaddaf | SEGMENT Mid-tier |
PROJECT Al Furjan West | AREA Al Furjan | SEGMENT Mid-tier |
PROJECT Emaar Beachfront | AREA Dubai Harbour | SEGMENT Luxury |
PROJECT Vida Dubai Mall | AREA Downtown Dubai | SEGMENT Luxury |
PROJECT The Palm Beach Towers | AREA Palm Jumeirah | SEGMENT Luxury |
Bayut’s H1 2025 Dubai Sales Market Report revealed a continued appetite for off-plan apartments across various buyer segments.
Those seeking affordable options mainly gravitated towards:


- Verdana Residence in Dubai Investment Park
- International City Phase 2
- Jade Tower in Majan
Buyers in the mid-tier segment were drawn to well-connected off-plan apartments in:
- Jumeirah Village Circle District 12
- Dubai Healthcare City Phase 2 in Al Jaddaf
- Al Furjan West
High-net-worth buyers eyeing luxury off-plan properties largely concentrated their attention on central and waterfront locations, including:
- Emaar Beachfront in Dubai Harbour
- Vida Dubai Mall in Downtown Dubai
- Palm Beach Towers in Palm Jumeirah
TOP PROJECTS FOR OFF-PLAN VILLAS IN DUBAI
PROJECT | AREA | SEGMENT |
|---|---|---|
PROJECT Camelia | AREA DAMAC Hills 2 | SEGMENT Affordable |
PROJECT Verdana 2 | AREA Dubai Investment Park | SEGMENT Affordable |
PROJECT R. Hills | AREA Dubailand | SEGMENT Affordable |
PROJECT Mudon Al Ranim | AREA Mudon | SEGMENT Mid-tier |
PROJECT June | AREA Arabian Ranches 3 | SEGMENT Mid-tier |
PROJECT Expo Valley | AREA Expo City | SEGMENT Mid-tier |
PROJECT District 11 | AREA Mohammed Bn Rashid City | SEGMENT Luxury |
PROJECT Nad Al Sheba 1 | AREA Nad Al Sheba | SEGMENT Luxury |
PROJECT Bay Villas | AREA Dubai Islands | SEGMENT Luxury |
Off-plan villas continued to attract attention across all budget categories in H1 2025. Buyers in the affordable bracket were particularly drawn to projects such as:
- Camelia in DAMAC Hills 2
- Verdana 2 in DIP
- R.Hills in Dubailand
In the mid-market category, the following projects stood out for their blend of lifestyle amenities and competitive pricing:
- Mudon Al Ranim
- June in Arabian Ranches 3
- Expo Valley
Those seeking luxury villa investments focused on prestigious new launches in well-established developments, such as:
- District 11 in Mohammed Bin Rashid City
- Nad Al Sheba 1
- Bay Villas in Dubai Islands
Commenting on the findings, Haider Ali Khan, CEO of Bayut, Head of Dubizzle Group MENA and Board Member of the Dubai Chamber of Digital Economy, said:
“We’re seeing a really interesting shift in Dubai’s property market this year. Demand remains strong, but price movements are becoming more measured, a positive indicator of long-term stability. At the same time, there’s a growing appetite for greater clarity around pricing.
That’s where tools like TruEstimate™ are proving invaluable. In fact, in May, 50% of ready transactions in Dubai were closed after a TruEstimate™ report was generated, underscoring just how crucial data-backed insights have become in helping both buyers and sellers make more confident decisions.”
That’s a wrap on our Sales Market Report for Dubai H1 2025. Stay tuned for Bayut’s forthcoming H1 2025 Abu Dhabi Real Estate Market Report, offering similarly in-depth insights into the investment trends in the capital.
Disclaimer: The above Dubai sales real estate market report (MKTRPTH12025) is based on prices for ready properties advertised by real estate agencies on behalf of their clients on Bayut.com (excluding room share), and is not representative of actual real estate transactions conducted in Dubai, unless specified as based on DLD data.


